

Case Study
Cutting OR Turnover Time from 47 to 20 Minutes
Establishing expectations and measuring performance leads to remarkable improvements in stakeholder satisfaction and hospital economics.
47 → 20
minutes average turnover, complex spine and joint cases
3×
case volume over the following four years
$47
average cost per operating room minute
210
surgical metrics to manage in one day across 6 rooms
“You can’t manage what you can’t measure”
Introduction
This statement by Peter Drucker emphasizes the importance of accurate data in managing and improving any organizational function.
The operating room in a hospital is the highest cost site of service, estimated, on average to cost $47/minute/room. Due to the reproducibility of surgical case flow, hospital management is afforded an incredible opportunity to improve efficiency and lower cost by applying technologies that provide accurate real-time measurement of performance.
Surgical case flow can be broken down into distinct measurable intervals, each with their own expectation for performance. First case of the day requires a defined time for Pre-op nursing to be ready, for anesthesia to sign-in and for surgeon to sign-in. Following these three metrics, the remainder of the first case and all subsequent cases require just 5 intervals to be documented in order to provide valuable data enhancing the efficiency for every case. These subsequent intervals include:
- In Room
- Anesthesia Ready
- Cut
- Closed
- Out of Room
The vast majority of hospitals do not currently enjoy a means to effectively communicate expectations and measure performance on these important, reproducible intervals. For example, a Surgical Services area with 6 Operating rooms and an average of 6 cases per room requires management to communicate expectations and measure performance for 210 distinct surgical metrics: 180 in-room intervals, and the 30 turnarounds between those cases. Performing this manually in a manner that provides real-time data to management is not possible.
Following is a case study demonstrating how effective communication of expectations and measurement of performance led to remarkable improvements in physician and staff satisfaction and dramatic improvement in hospital economics.
Case Study
Spine and Joint Institute at Redlands Community Hospital
In 2012 a group of surgeons and the hospital administration came together under a co-management agreement creating the Spine and Joint Institute with the intention to improve the orthopedic and spine surgery service lines in the areas of patient, staff and surgeon satisfaction, outcomes and hospital economics. One initiative that proved to be incredibly valuable in meeting all stakeholders’ interests was the initiative to better communicate surgical case flow expectations and measure performance.
“...a reduction in turnover time from an average of 47 minutes to 20 minutes for complex spine and joint cases.”

This initiative began as a manual process for recording each of the intervals noted above on a sheet with the expectations clearly defined. What followed was a significant improvement in surgeon and anesthesia sign-ins, improvements in all case flow intervals and a reduction in turnover time from an average of 47 minutes to 20 +/- 2 minutes year after year for complex spine and joint cases.
The efficiency and consistency developed through this approach caught the attention of all local and regional orthopedic and spine surgeons and the next four years saw the tripling of case volume at the Spine and Joint Institute as surgeons moved their preferred site of service to the hospital that demonstrated consistency and a respect for their time. Hospital costs were reduced, and hospital revenues soared all attributable to an organized and well managed process for surgical case flow.
This well documented success was only slightly hampered by the time and effort it took to manually accumulate the data and produce the analytics that enhanced management efforts.
2024
Digital Case Flow Software
In 2024 the manual process of communicating expectations and acquiring data was greatly enhanced with Synchrony, a digital software application that communicated clear real-time expectations via a count down clock with performance data displayed in real-time for all members of every operative team. This has enhanced effective management as real-time data is displayed serving to drive improved performance of all operative team members.
Synchrony is the application this section describes. See how Synchrony measures every interval.
Data Acquisition
Data is collected for the following intervals and assigned to the following team members with the following expectations:

Display of Real Time Data
Following is an example of the display available to all members of the team in real-time indicating minutes saved or lost by team member:

- Minutes Saved
- Minutes Lost
- Duration
- Forgivable
This display demonstrates aggregate time savings (green) or time loss (red) for the entire team. It displays personal team member contribution and step by step performance for each case. Hovering over any red bubble will show the defined reason for the delay.

Analytics
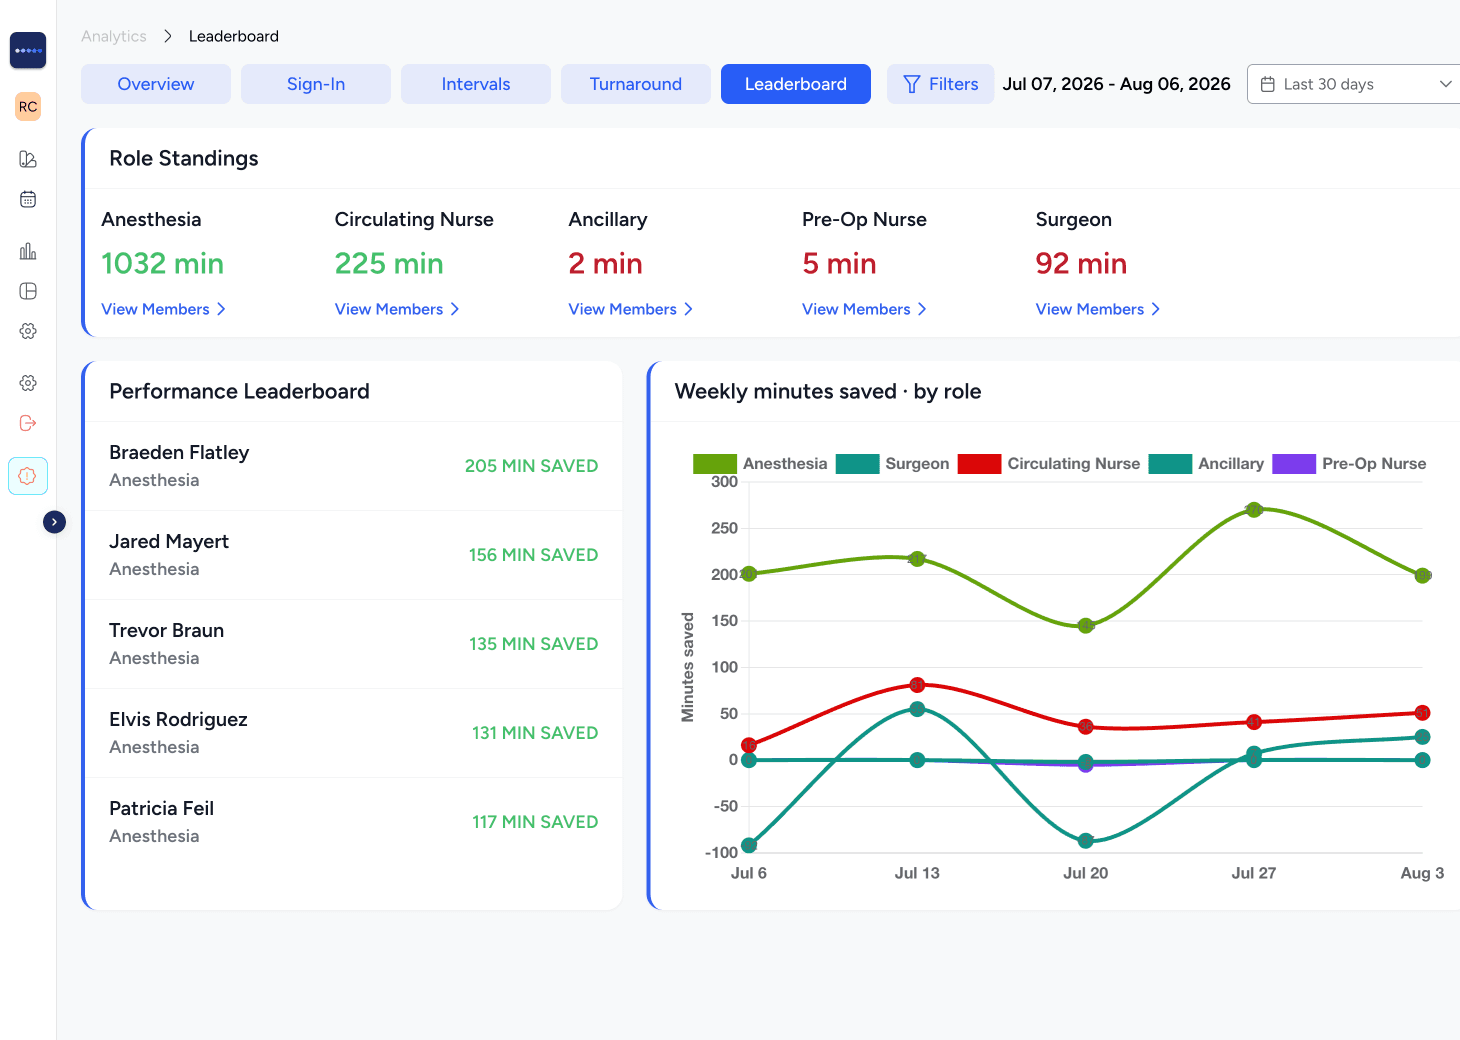
All data is aggregated and available for important analytics that can be produced and updated in real time. Following are some example analytics produced:
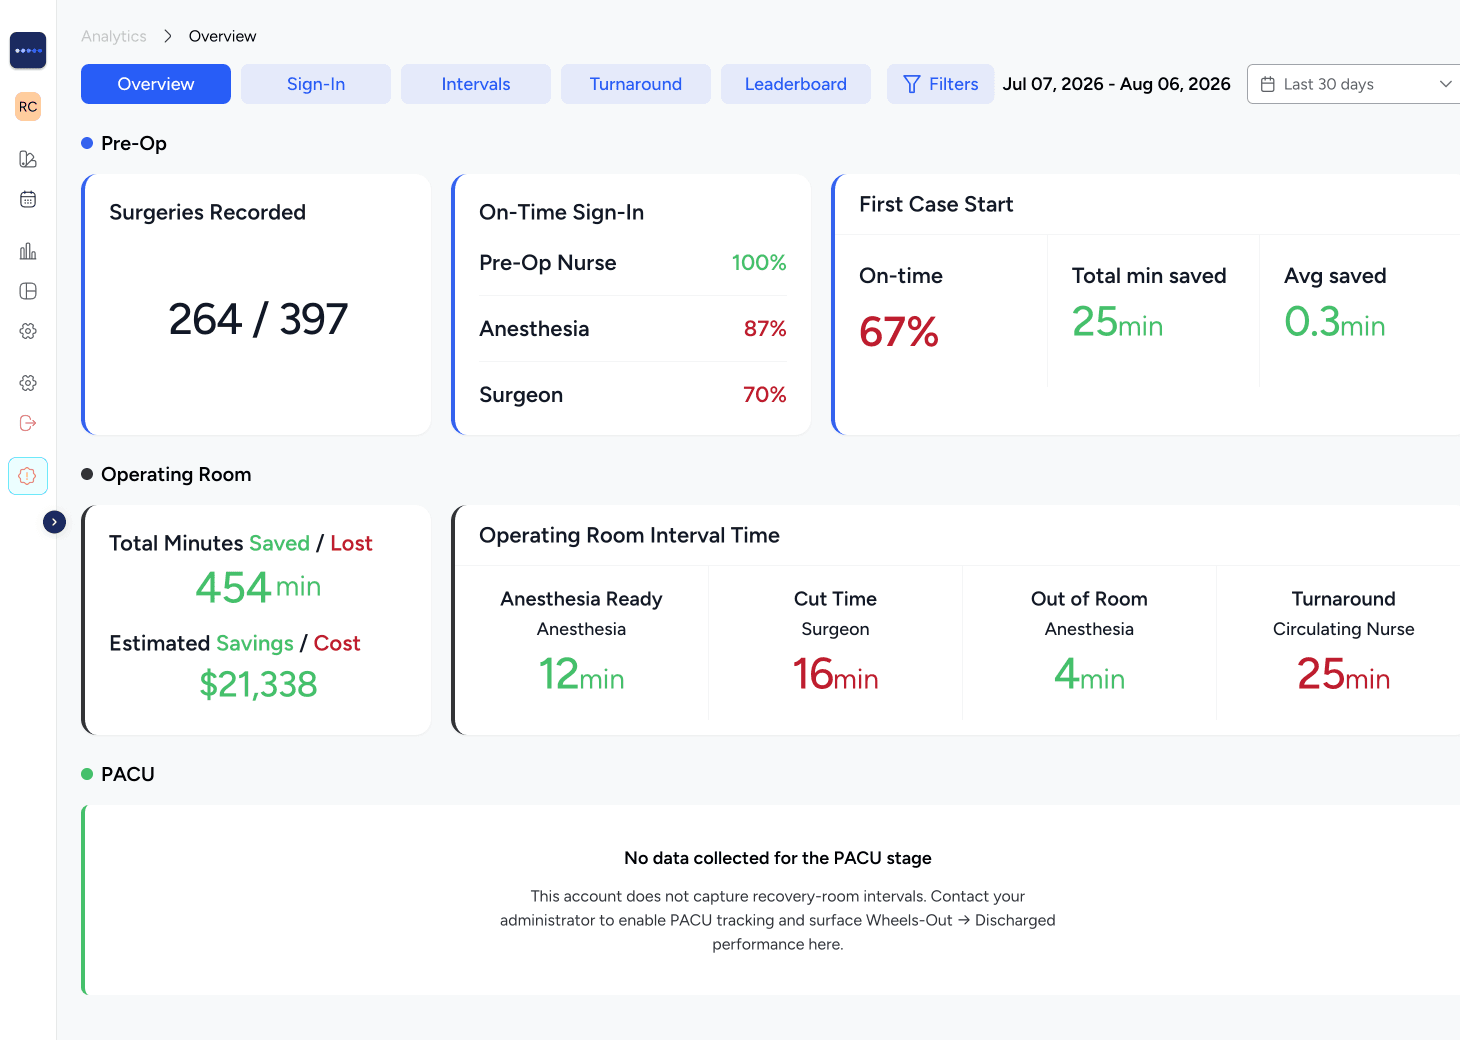
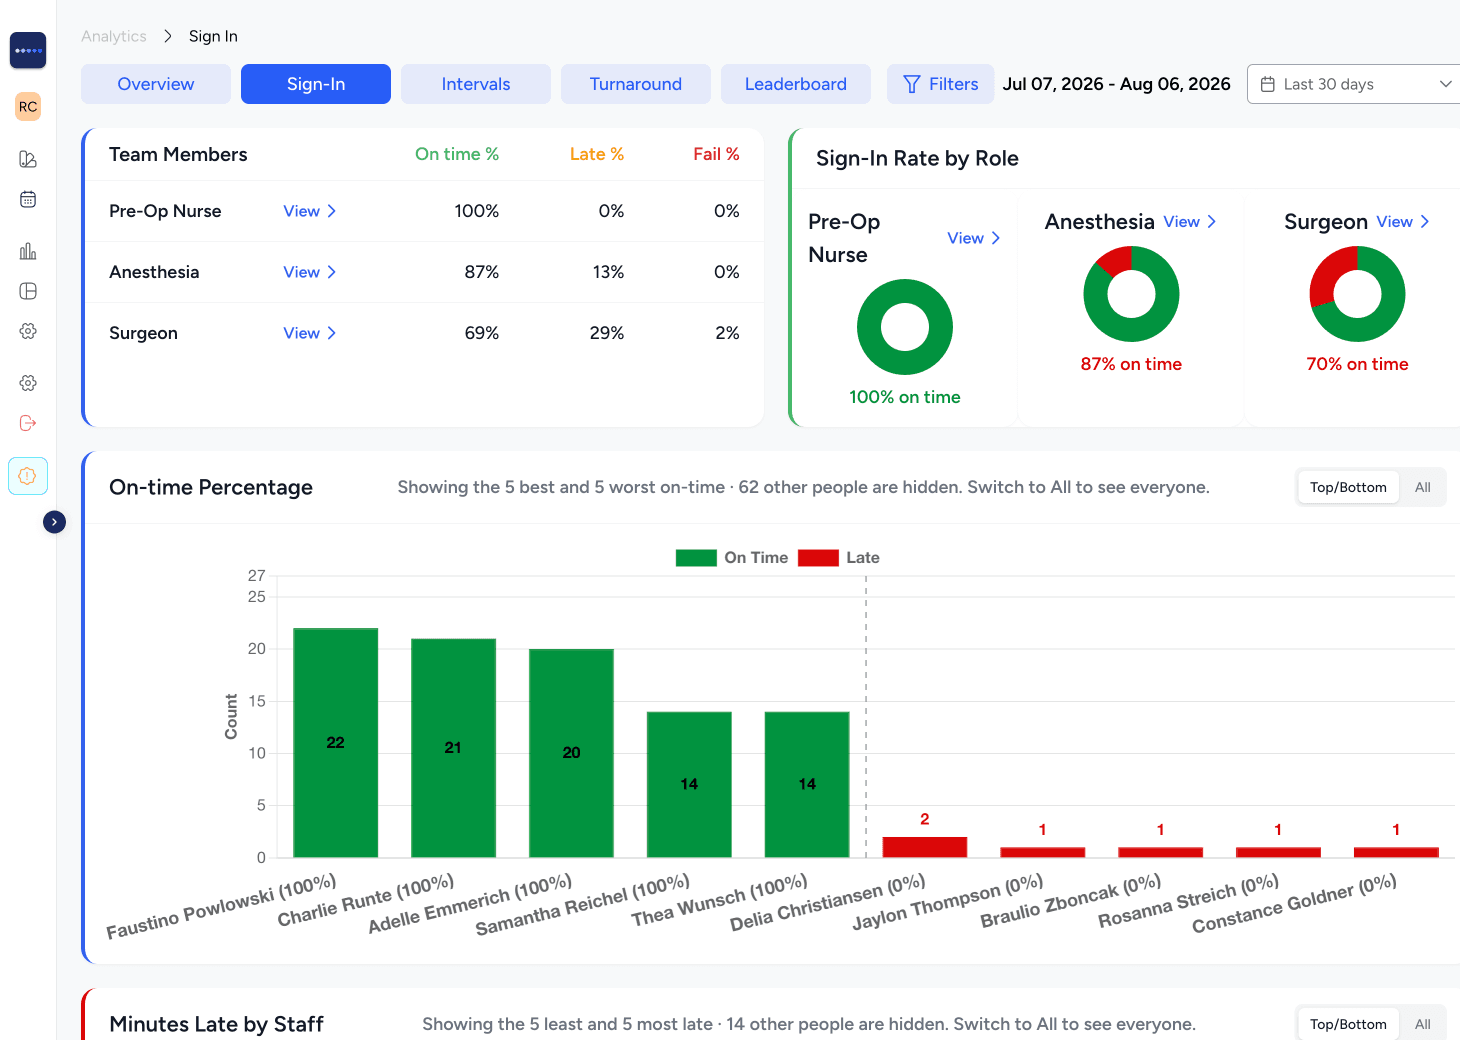
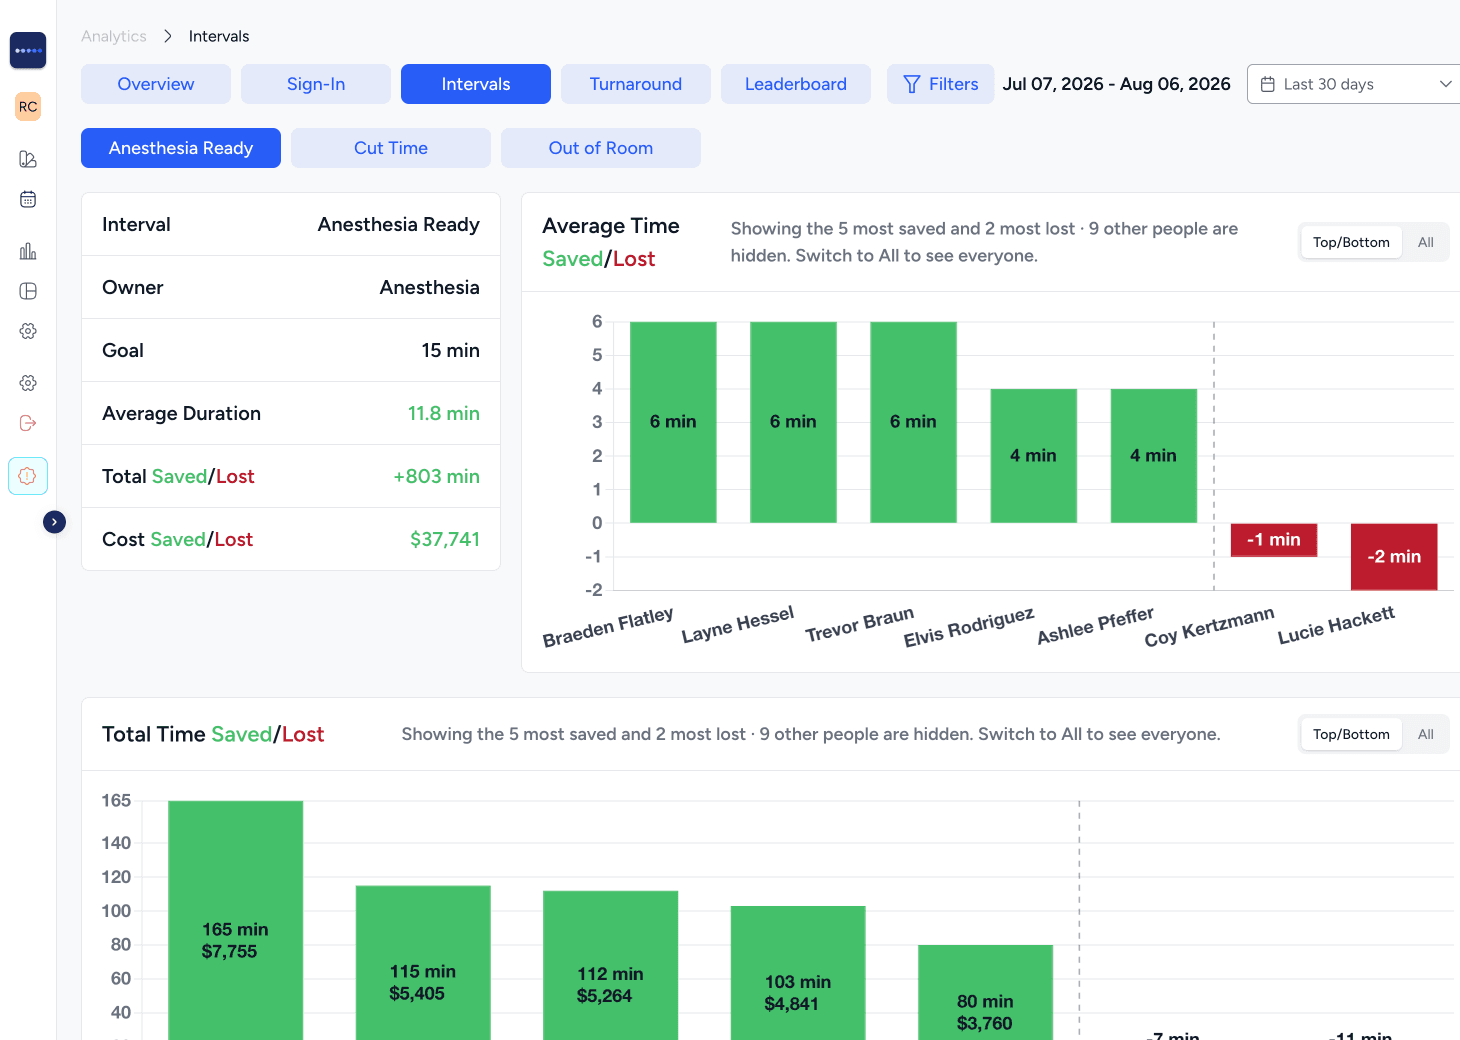
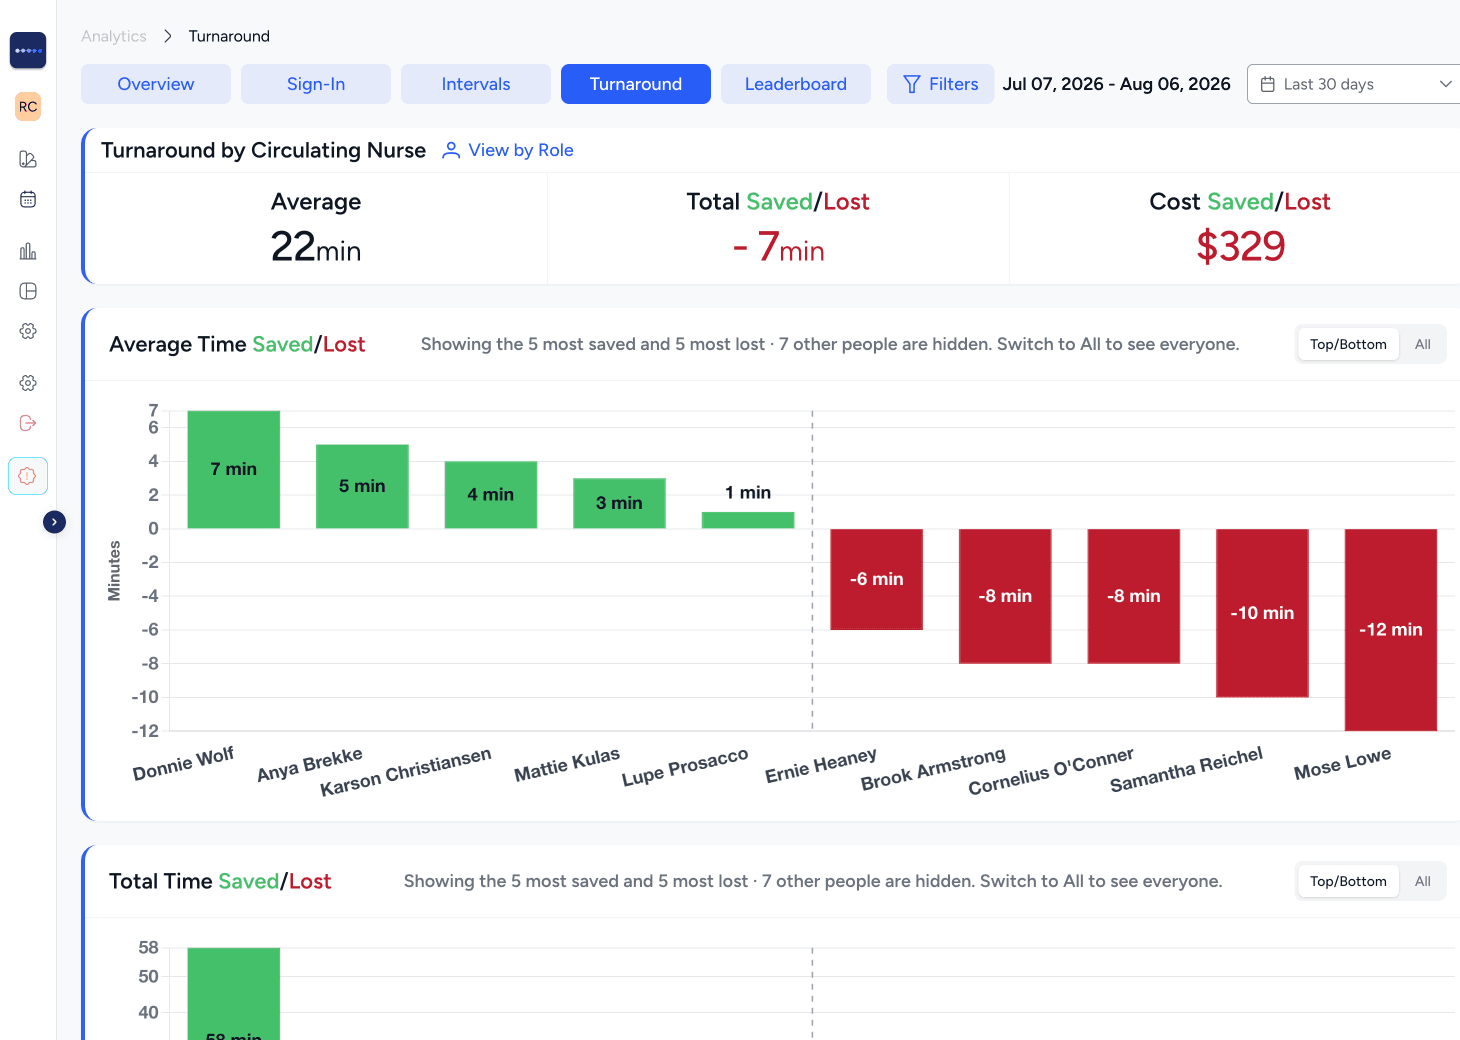
Turnaround is the measure this whole account turns on. See how turnaround time tracking works room by room.
Summary
Improving surgical case flow efficiency benefits patients, staff, surgeons, anesthesia, the hospital and the community. Patient wait times are reduced. Staff satisfaction is increased through clearly defined responsibilities and recognition for their performance. Anesthesia and surgeon experience is enhanced through the comforts of consistency and time efficiencies. Lastly, hospital economics are greatly improved through reduced costs per case and enhanced revenue through market share increase as surgeon come to appreciate the efficiency provided to them and their patients.
Run this method in every room
Thirty minutes to see the platform, then two ways to start measuring in your own ORs.