

From the morning schedule to the day’s numbers.
A surgical day on Synchrony starts with the schedule and ends with the numbers. In between, the team in each room confirms every interval with one tap on the tablet, and the dashboard fills in while the day is still running.Every figure it shows started as one tap in an operating room.
Request a Demo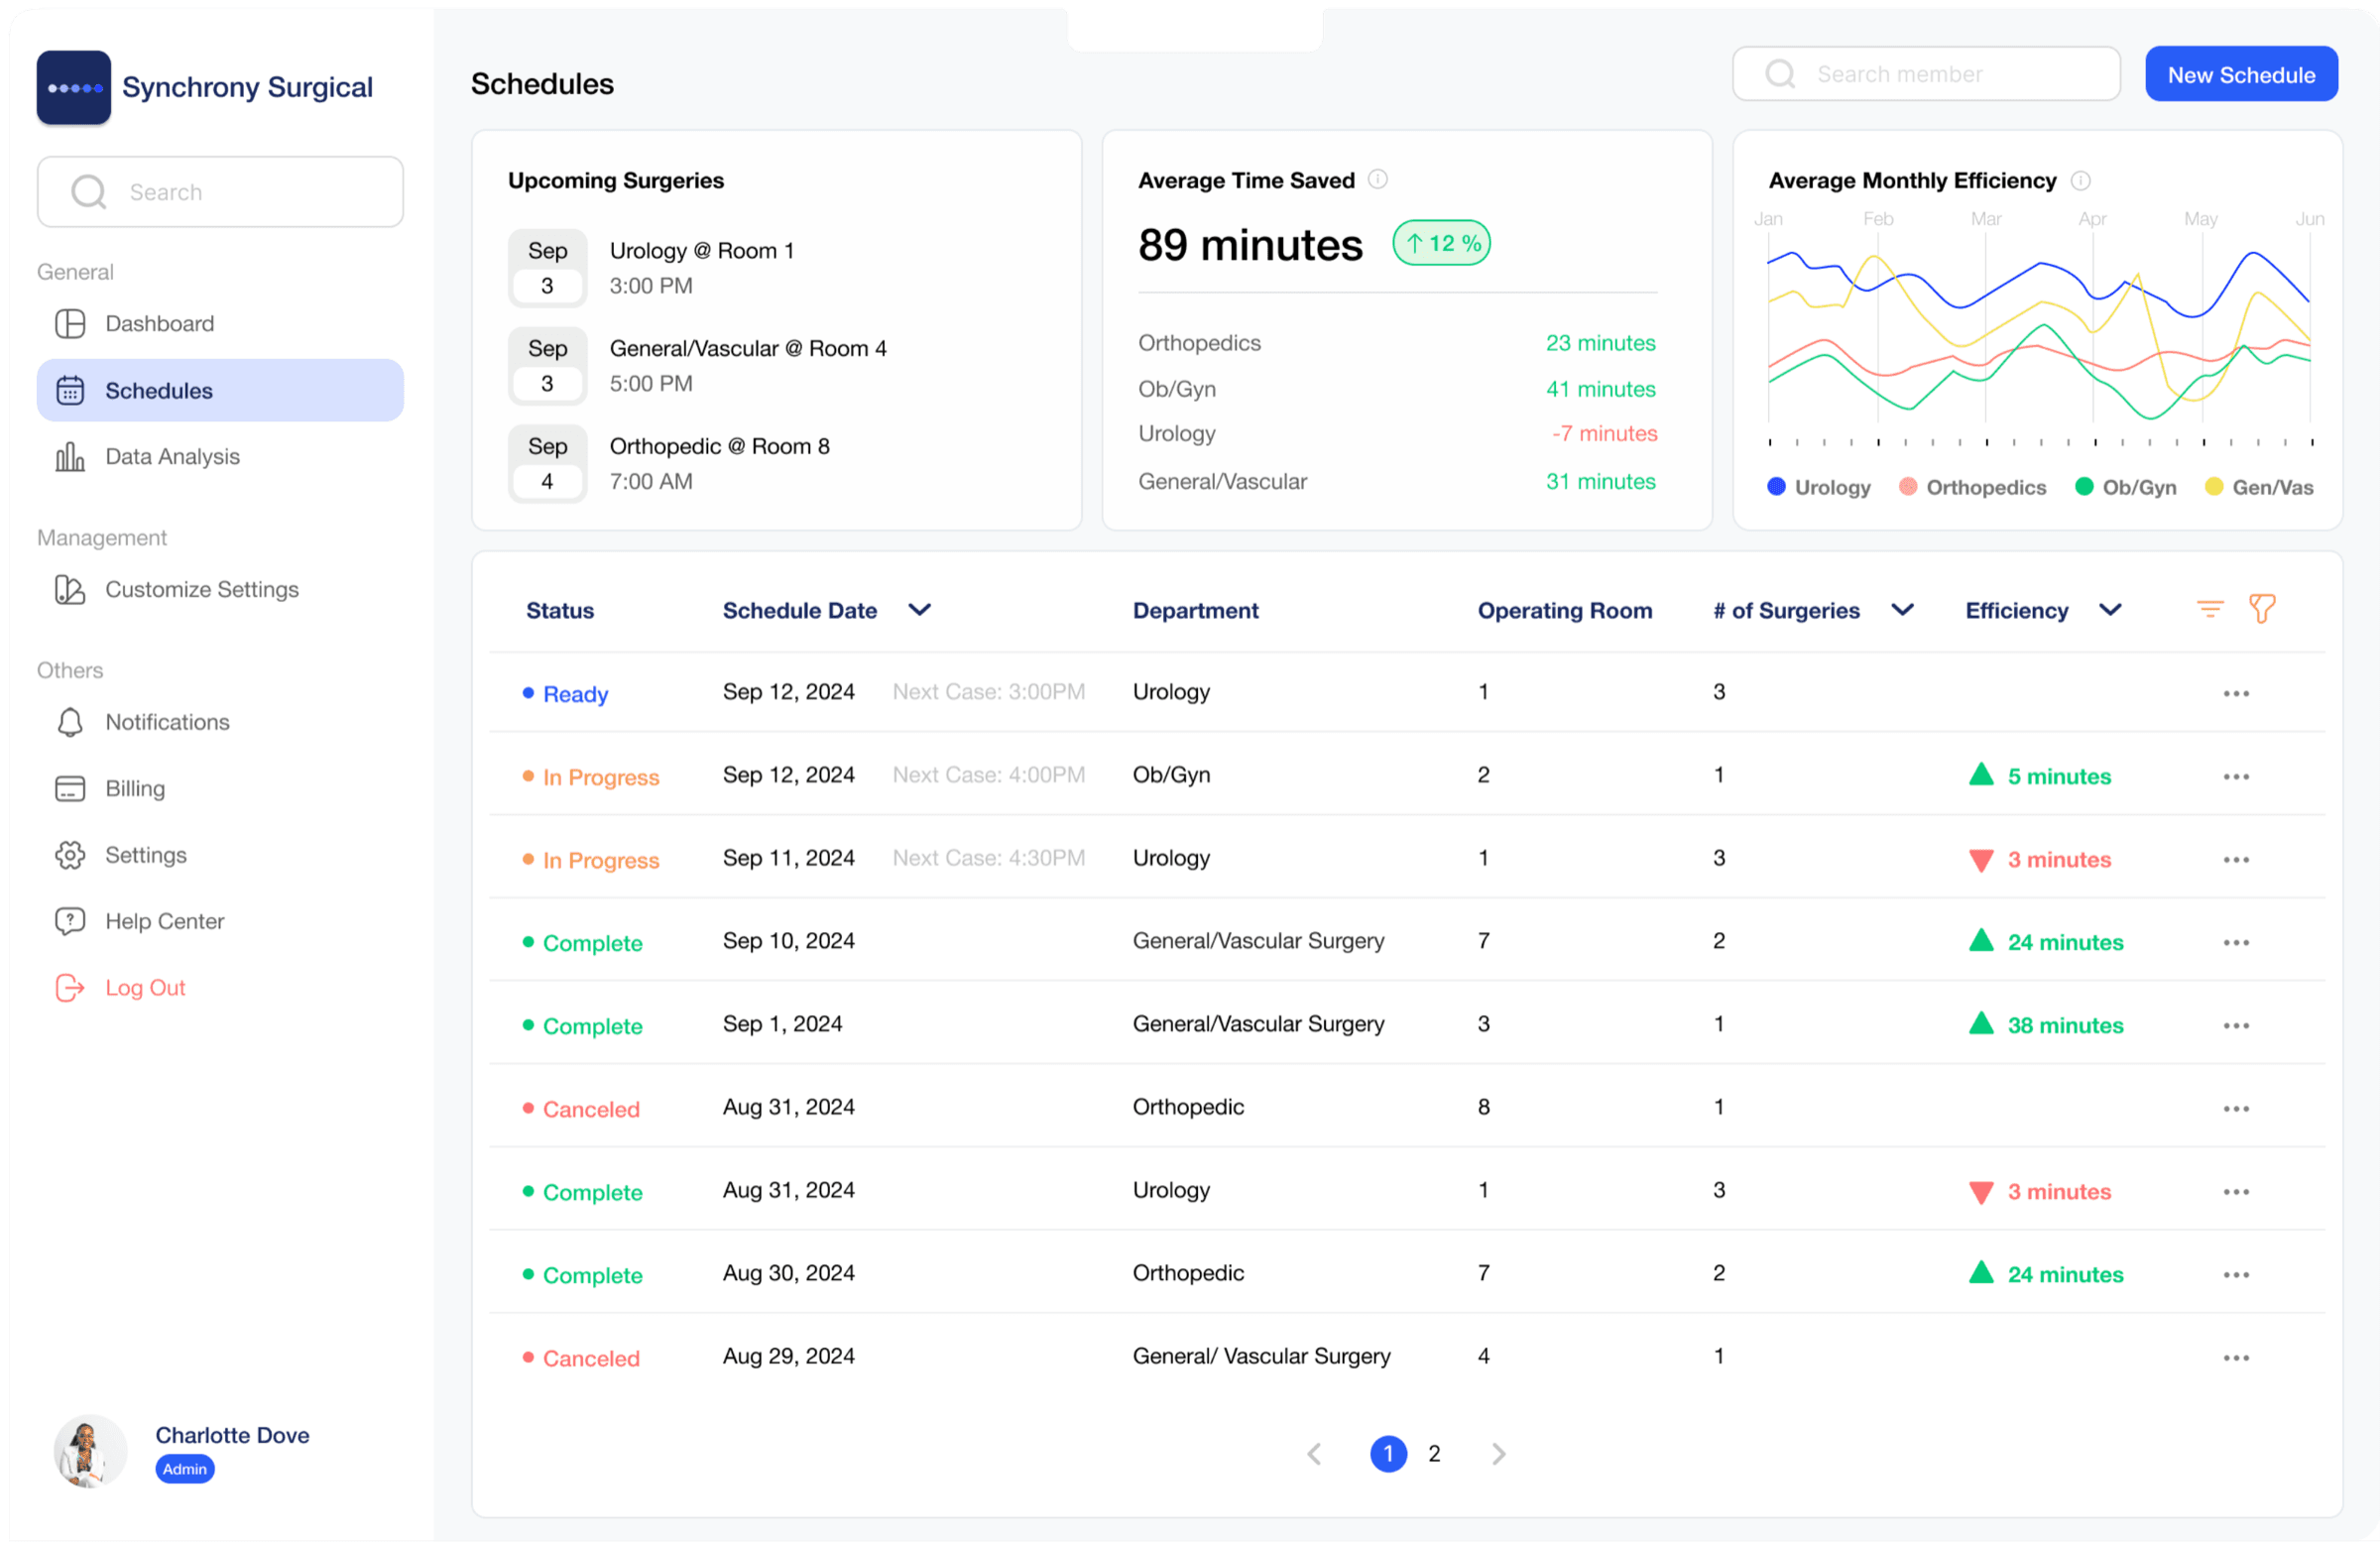
How the platform works
Schedule Surgeries
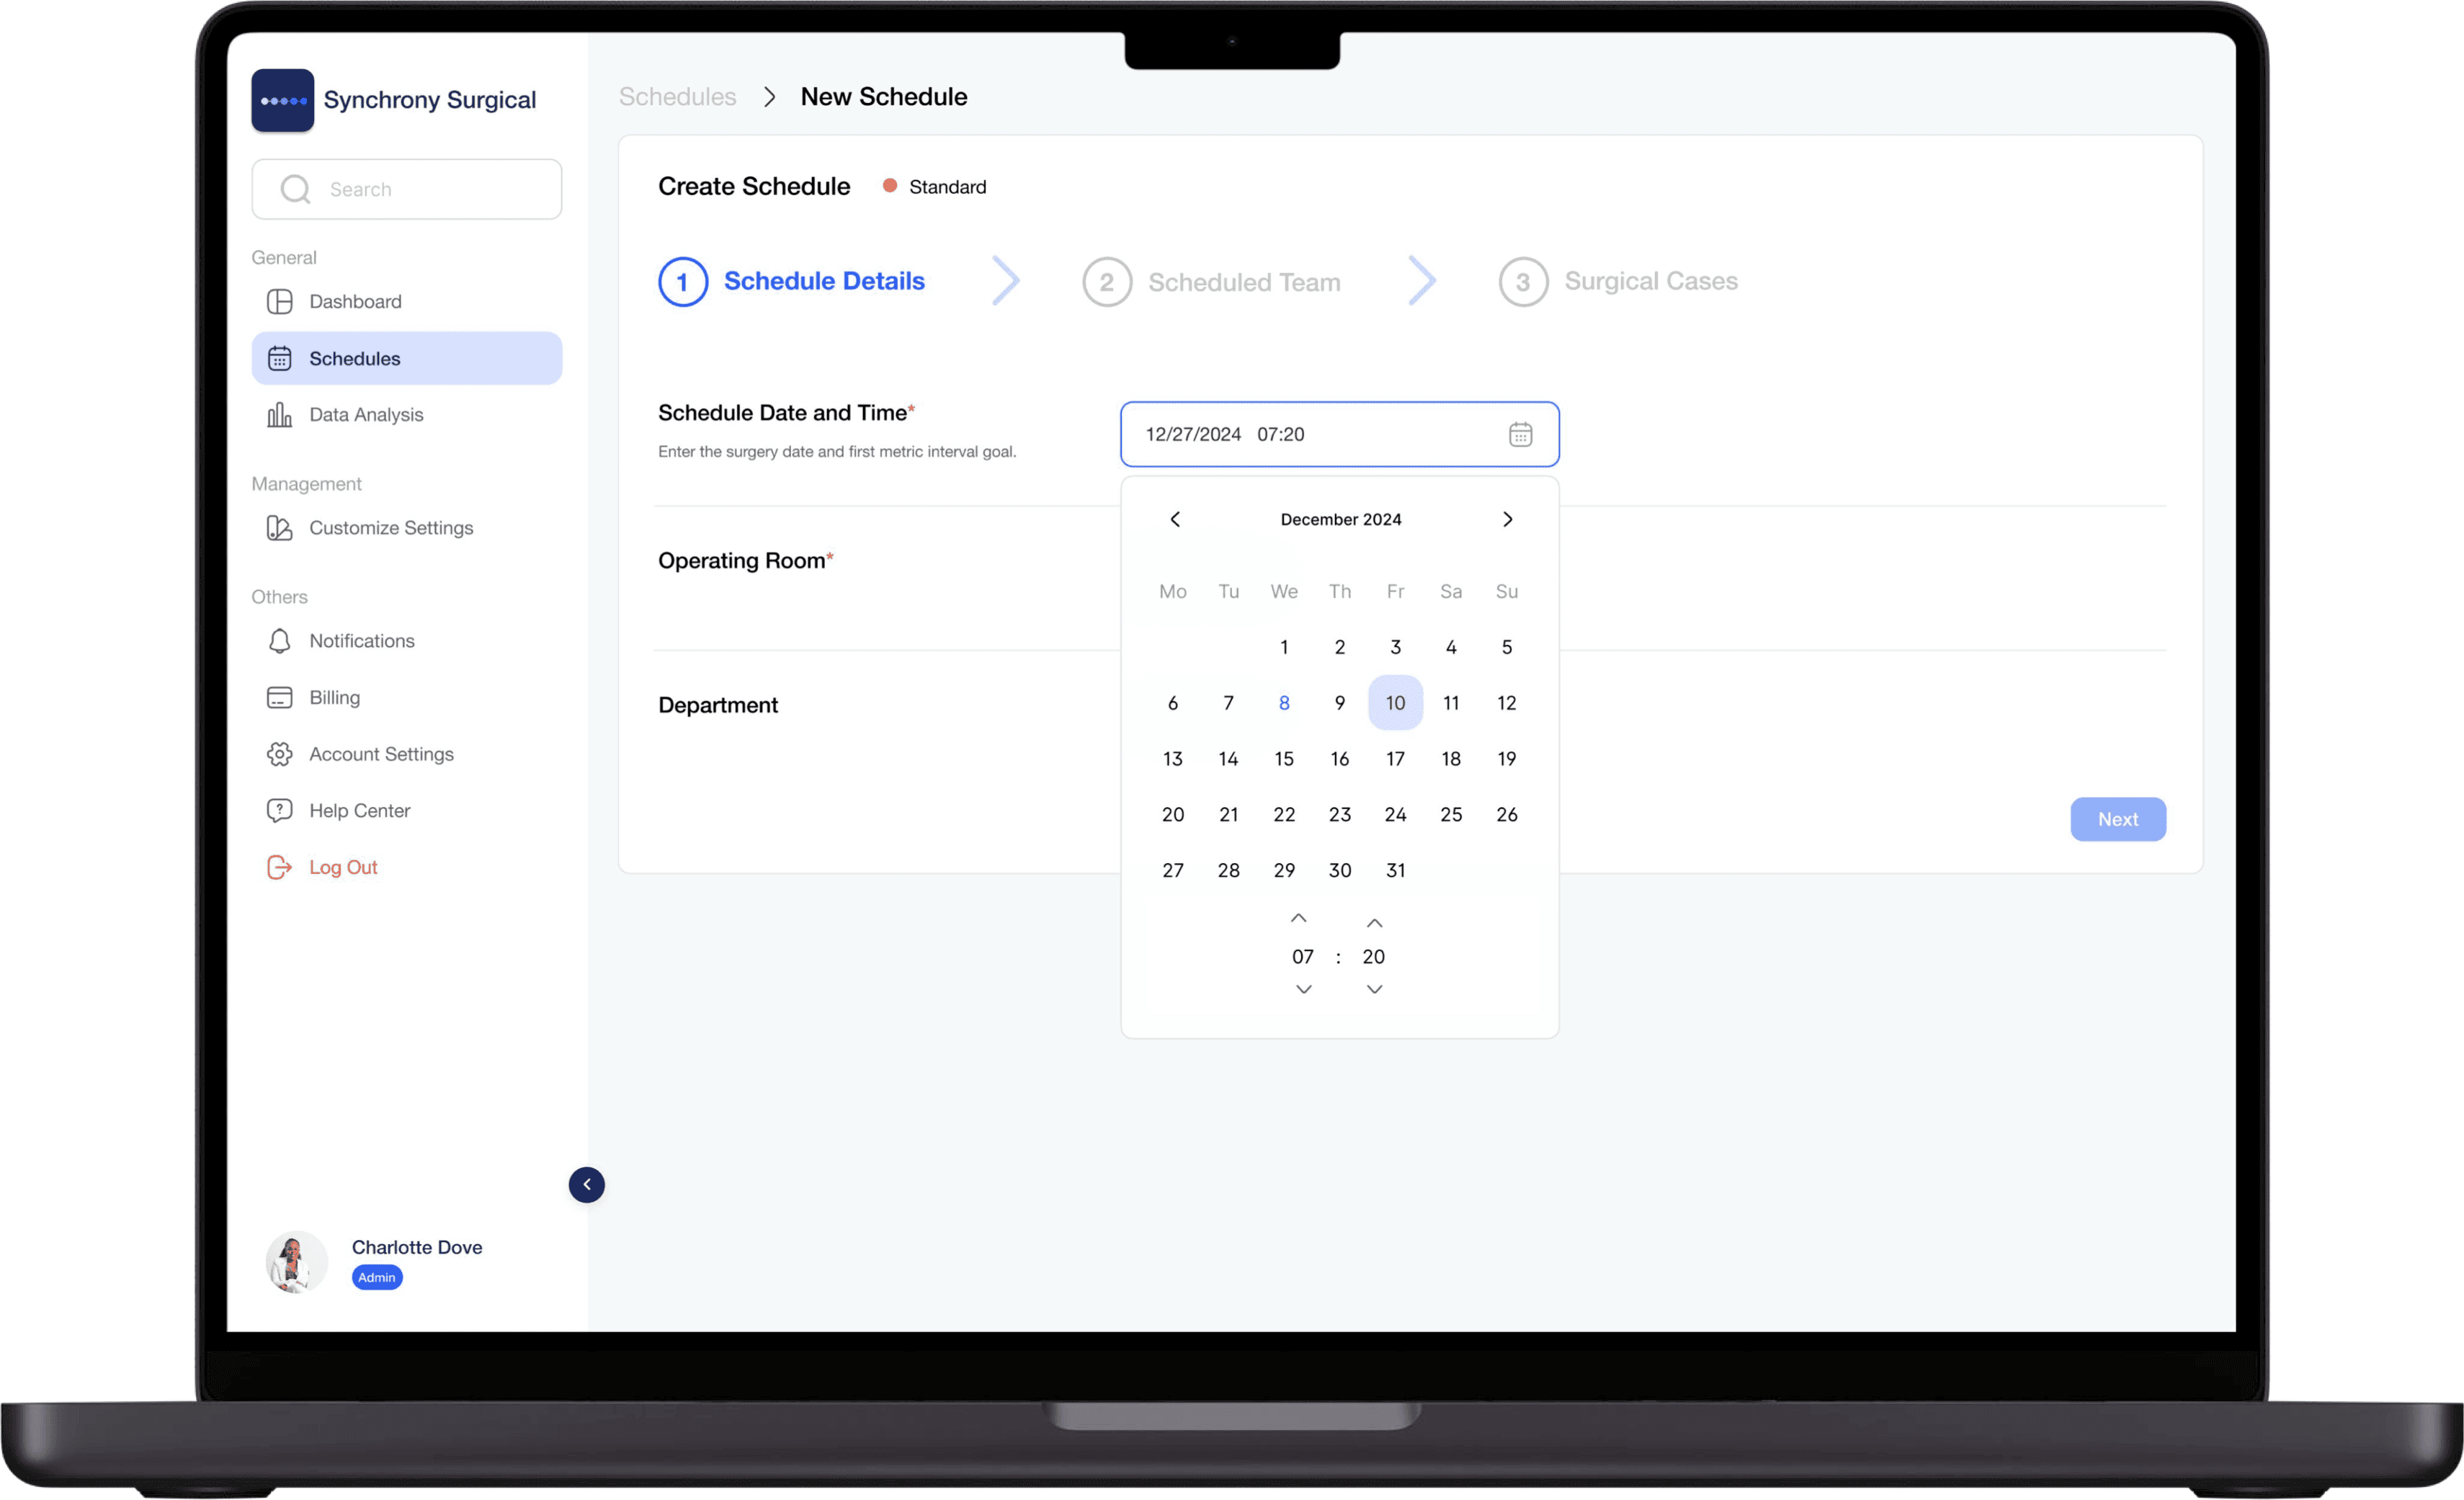
Once the schedule is set, all cases are loaded through the administrative portal. This requires, on average, 30 seconds per surgery.A case can call for a room, a department, a surgery type or a staff member that has not been set up yet. Any of them can be created while you are scheduling, so a gap in the setup fills itself the moment it is found. Nothing has to be provisioned before go-live.
Collect Surgical Metrics
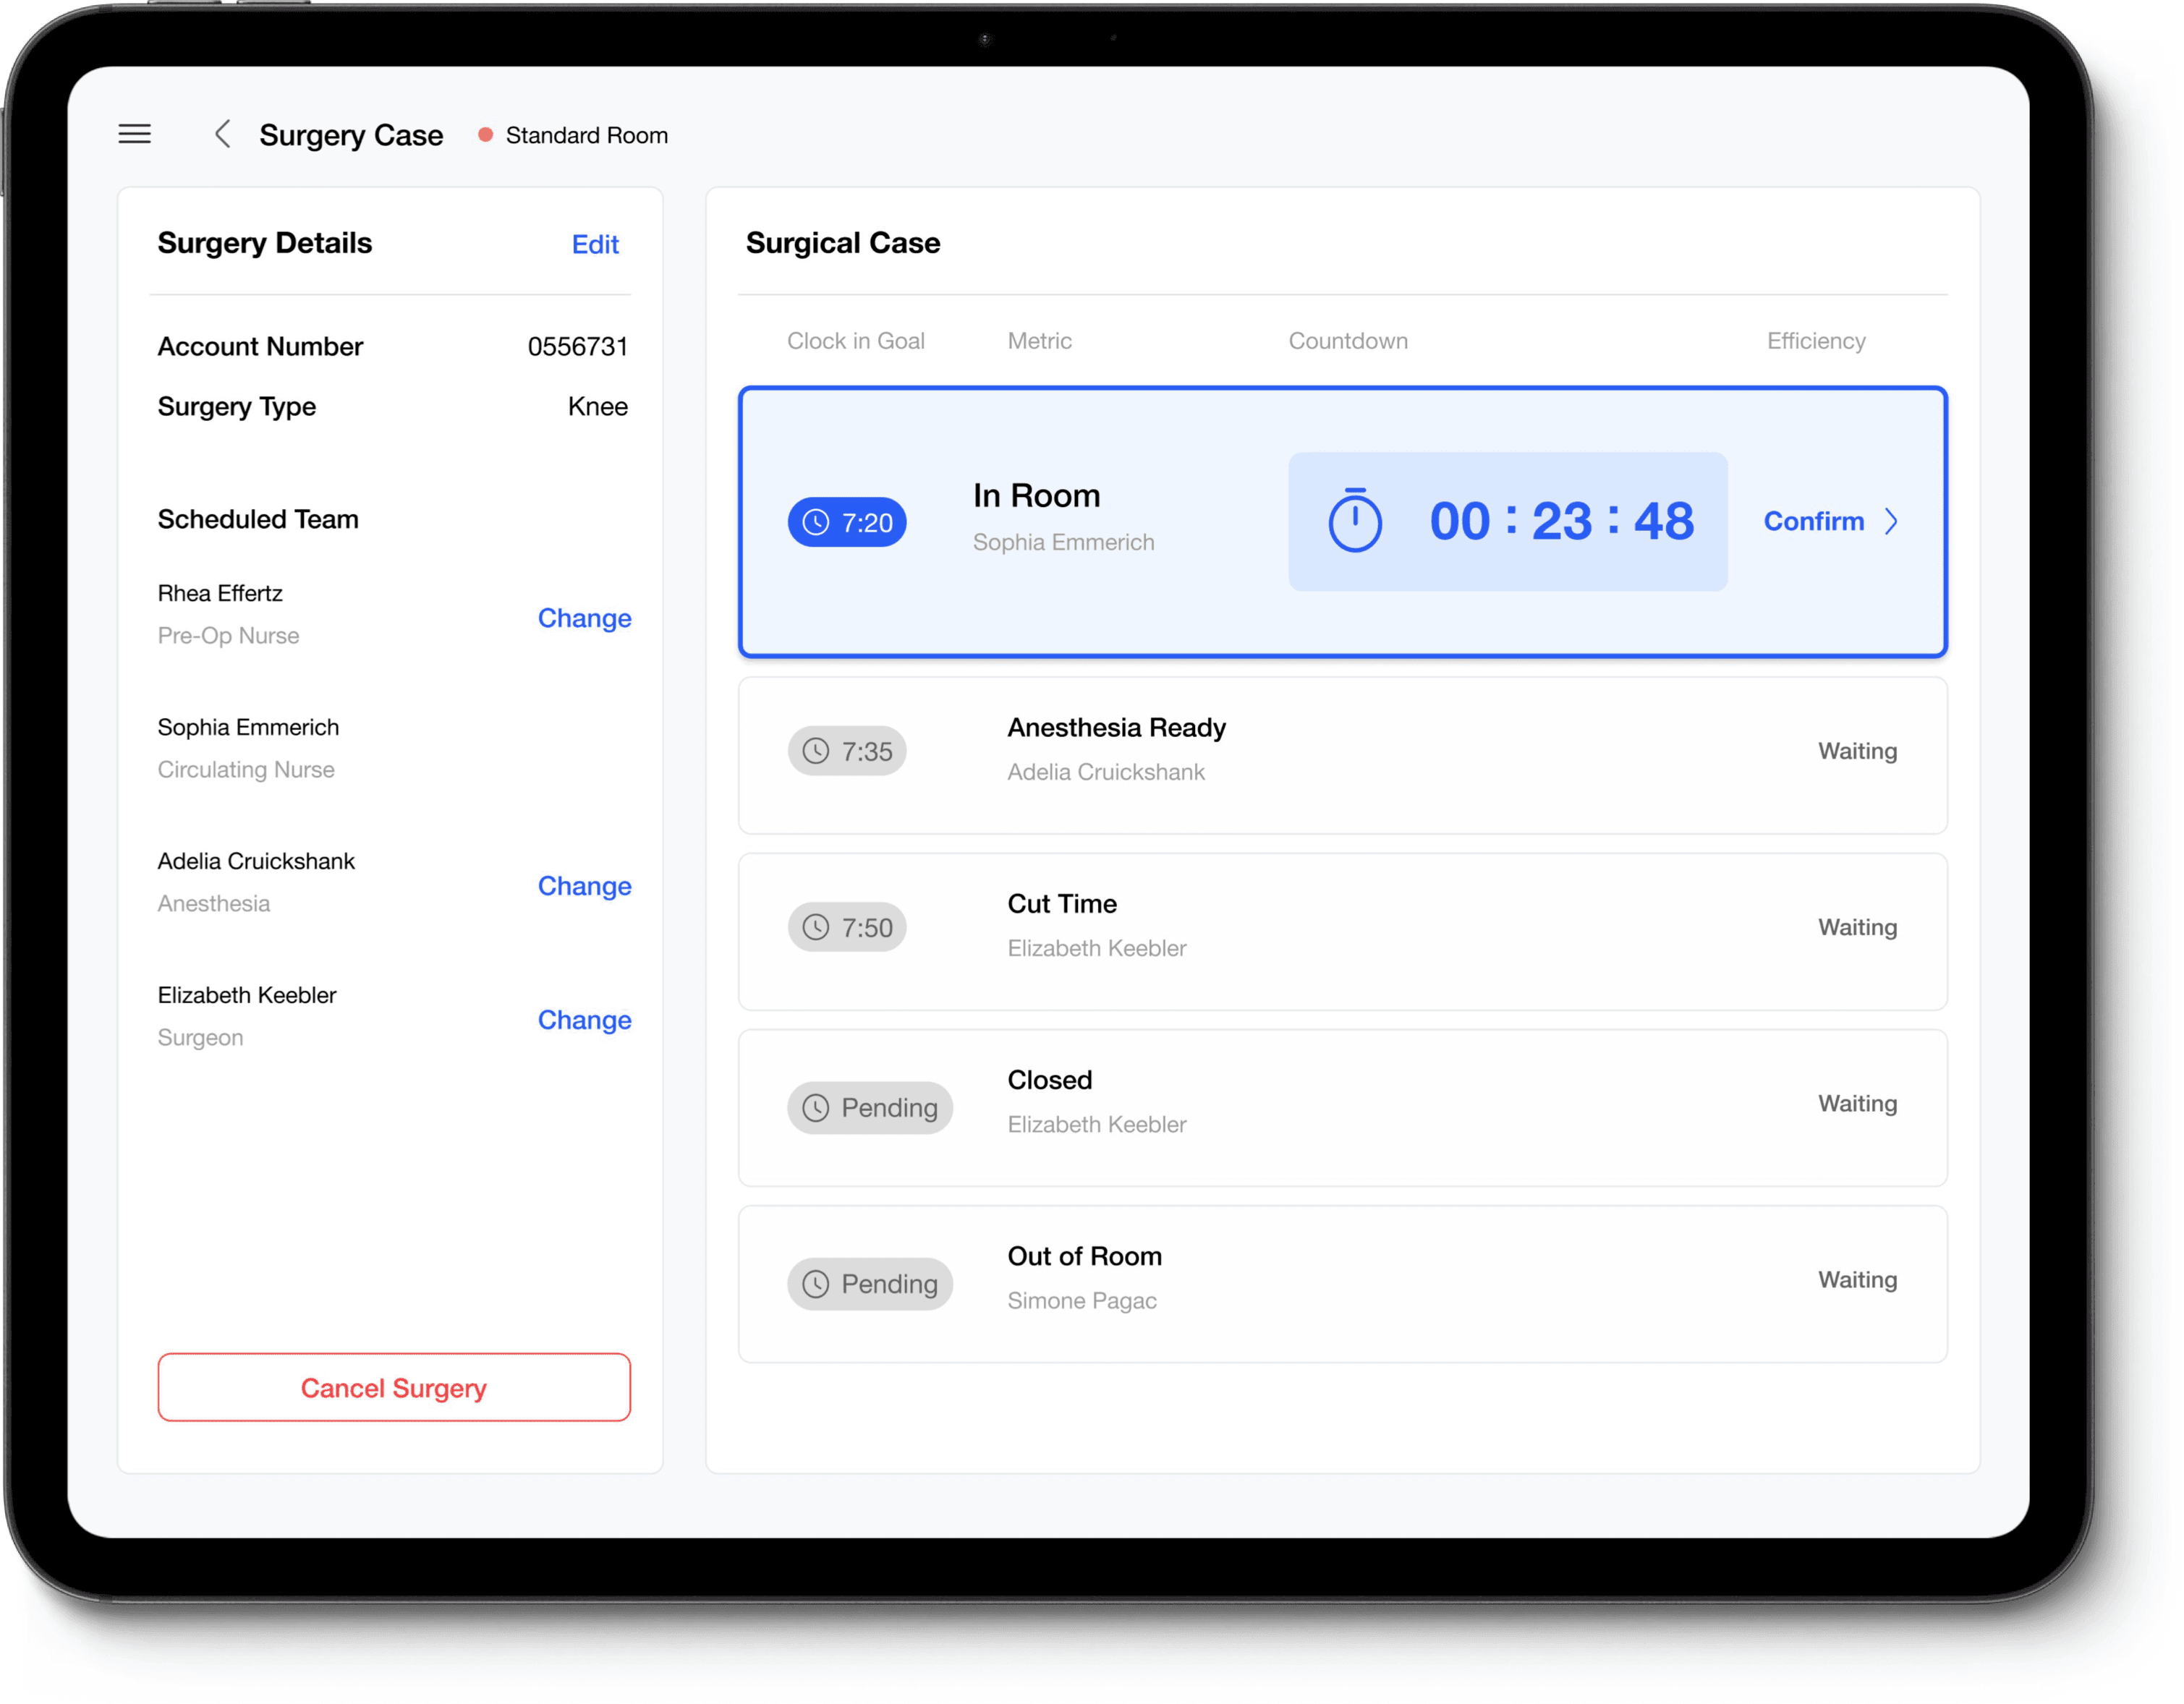
The tablet will list all cases for the day, and the surgical team will select the case they are working on. The tablet will then display the intervals for that case, and the surgical team will record each interval with a single tap on the tablet.That happens about five times over a case, in the order the case runs. Each tap takes a moment: there is nothing to type, nothing to look up, and no form to complete afterwards.One confirmation reaches the other tablets and the real-time dashboard at once. Nobody enters the same time twice, and nobody re-keys it into another system later.
- In Room
- Anesthesia Ready
- Cut
- Closed
- Out of Room
Analyze Performance
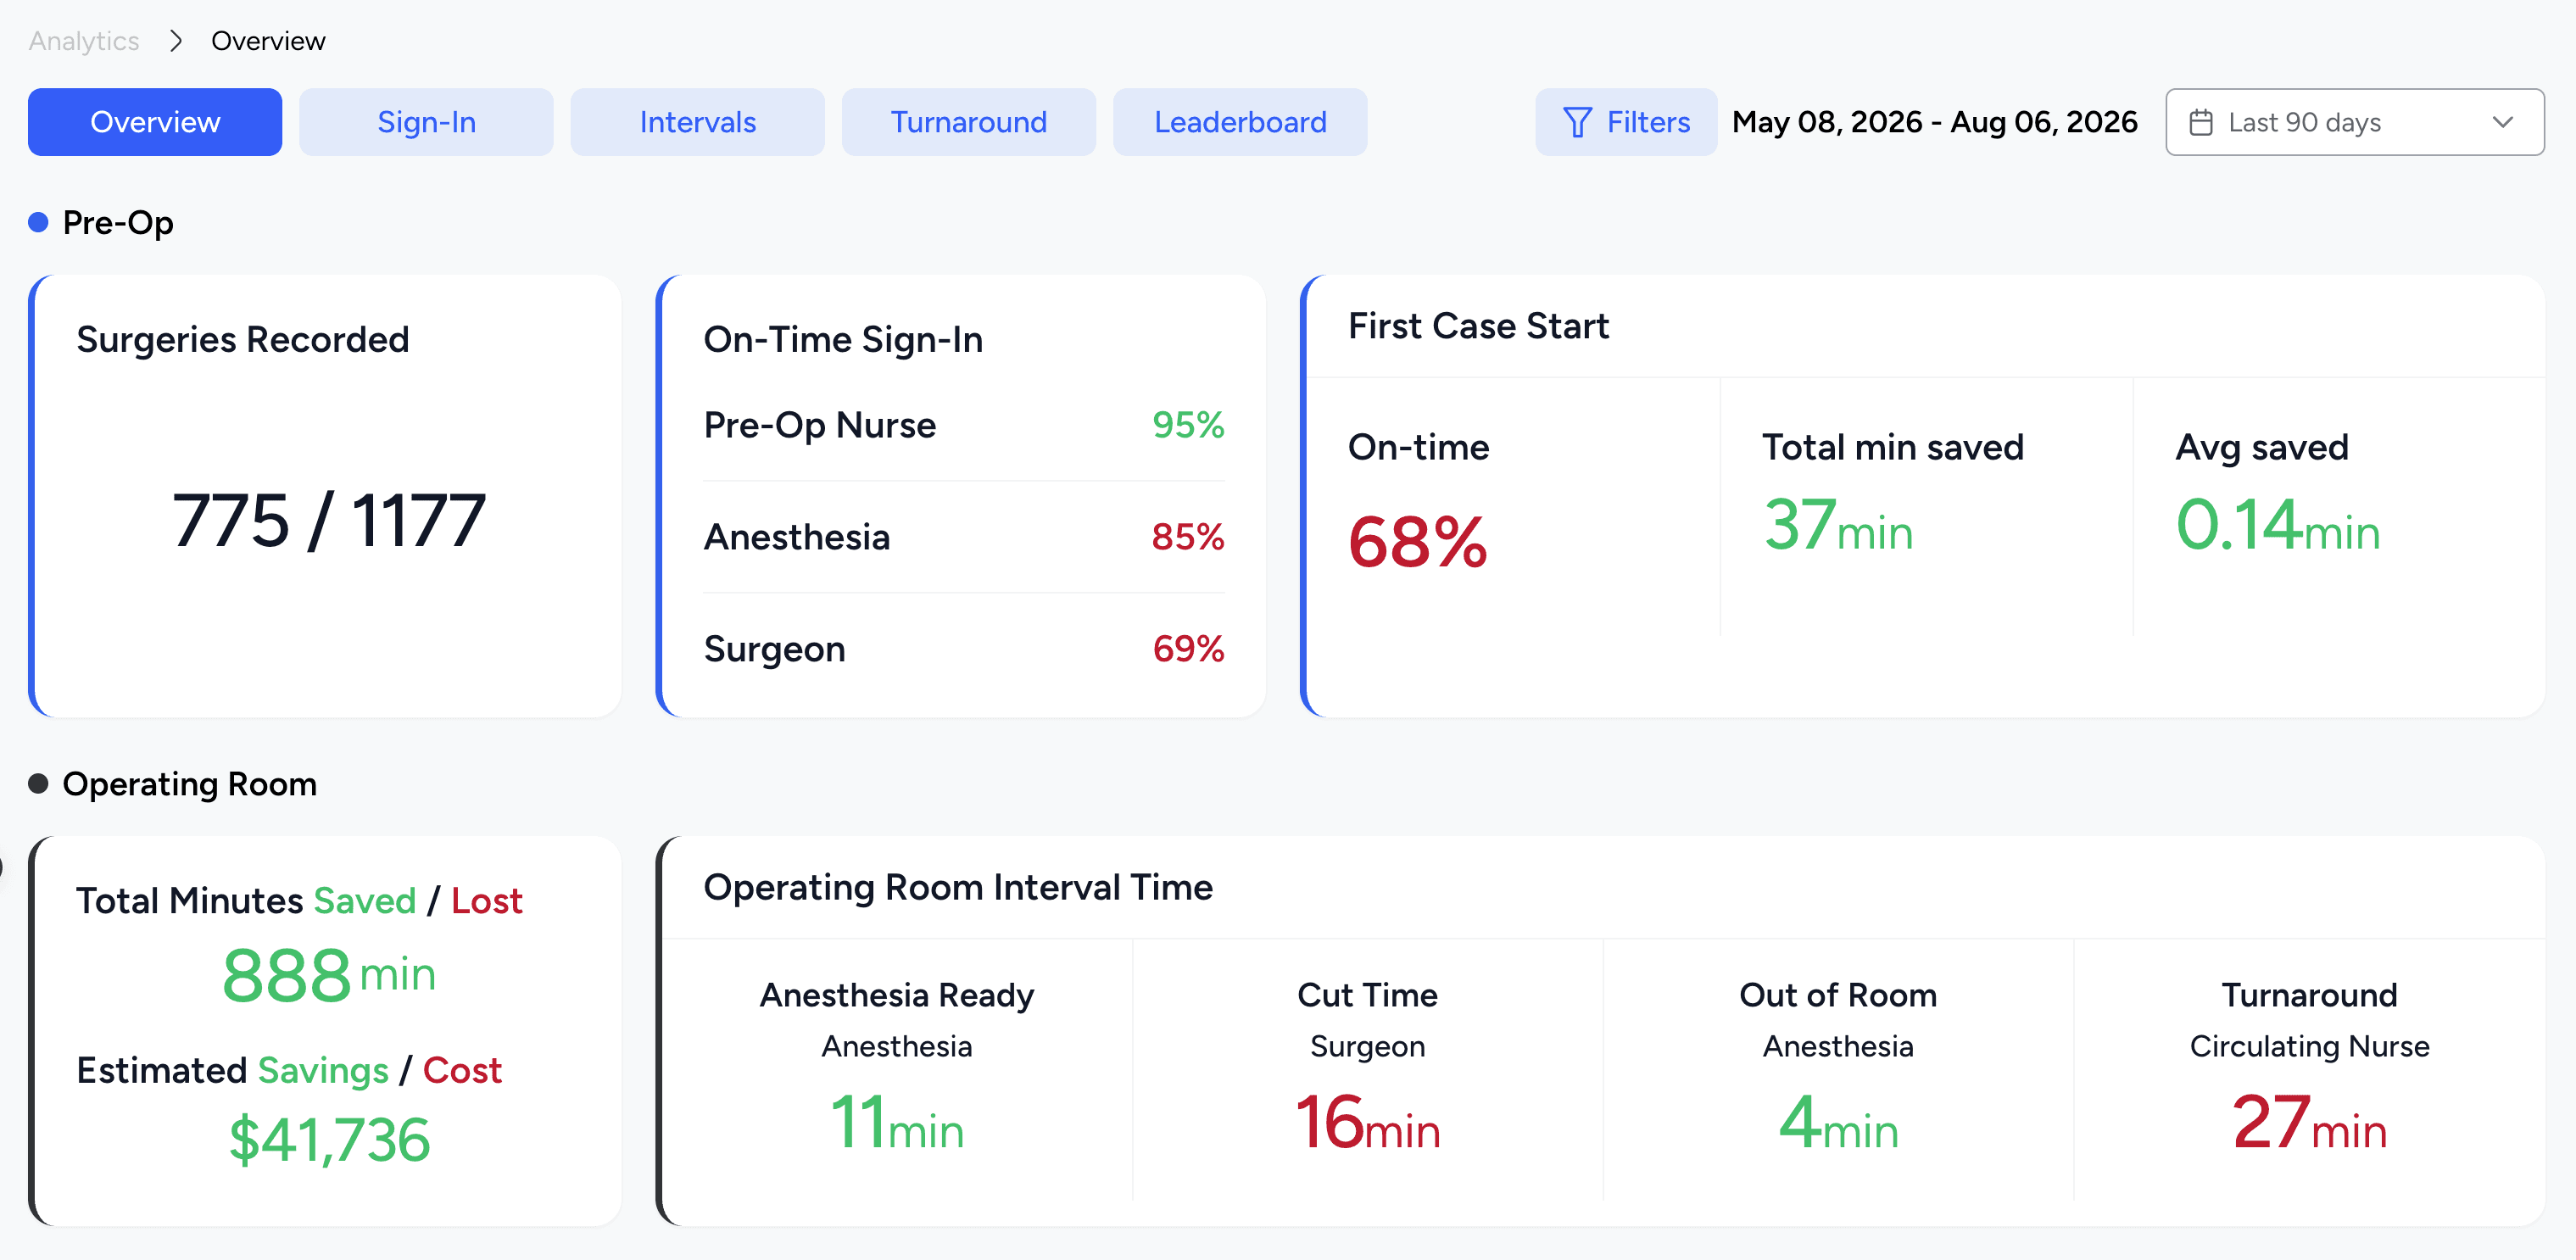
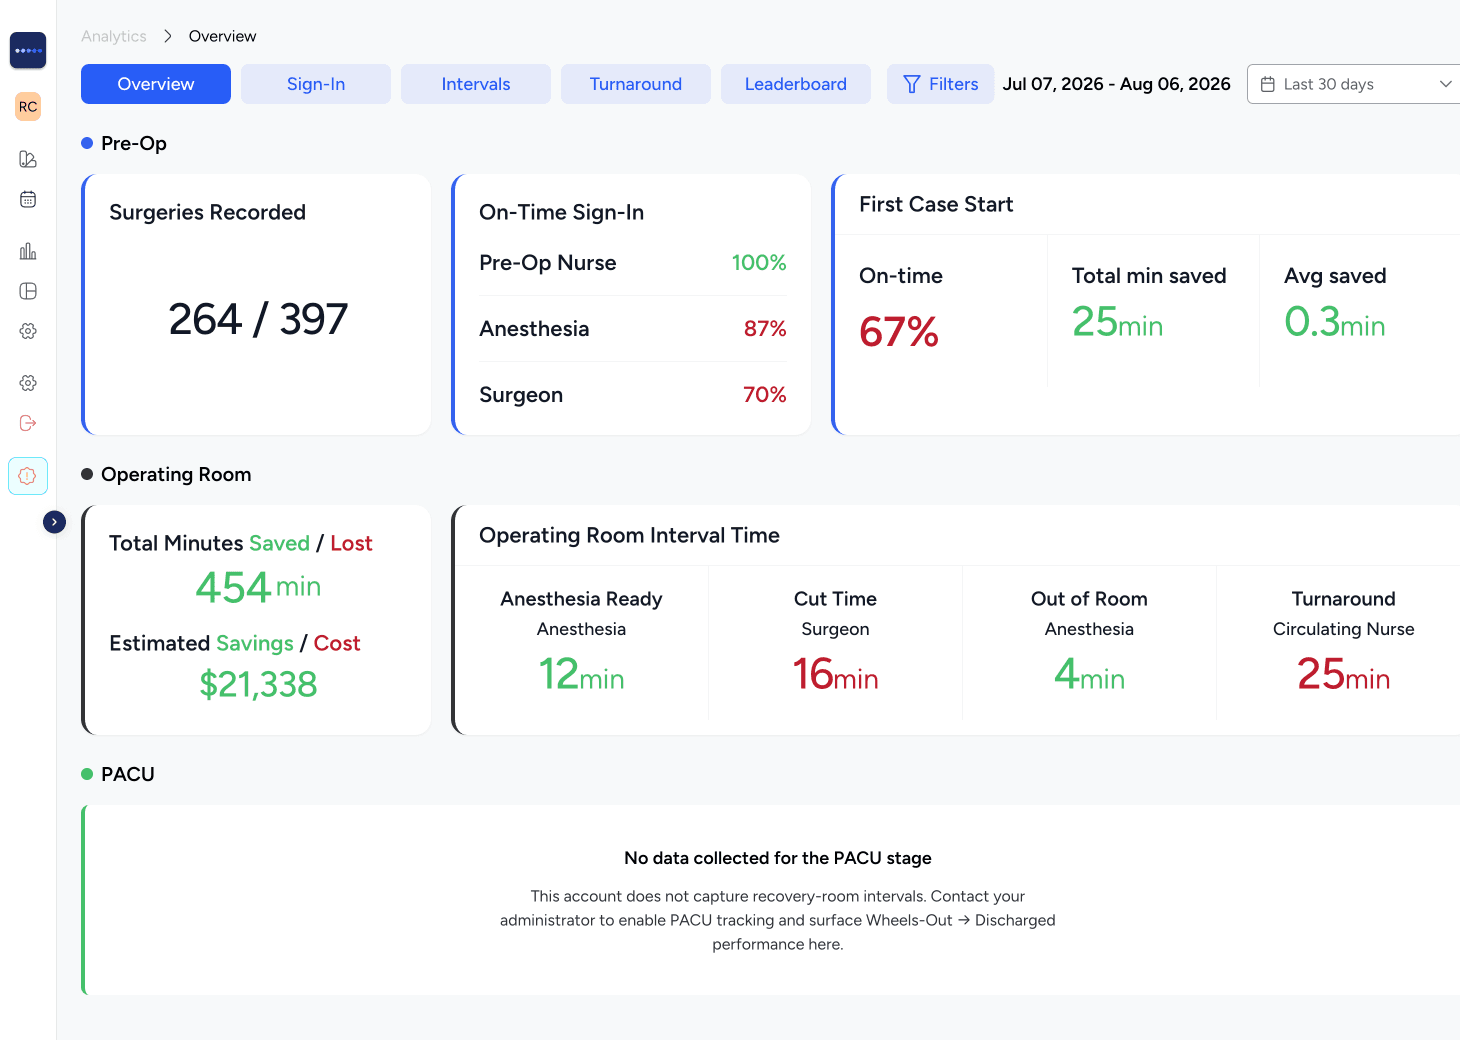
Analytics gives management a wide range of detailed insight. Management can filter by metric, team member, date range, reason for delay, and much more.
Inside the analytics
Analytics turns the data captured into decisions.
Select a view to see it in the app.
See it on your own numbers
Walk the full suite in a 30-minute live demo.