

Solutions
Reduce Operating Room Turnaround Time
Turnaround is the metric that quietly costs you cases, and the one most systems never measure. Synchrony tracks the time between one patient leaving the room and the next patient entering it, in real time, for every case, and shows you exactly where the minutes go and who saved them.
Request a DemoMeasured in a 60-Day Assessment, or continuously from day one.
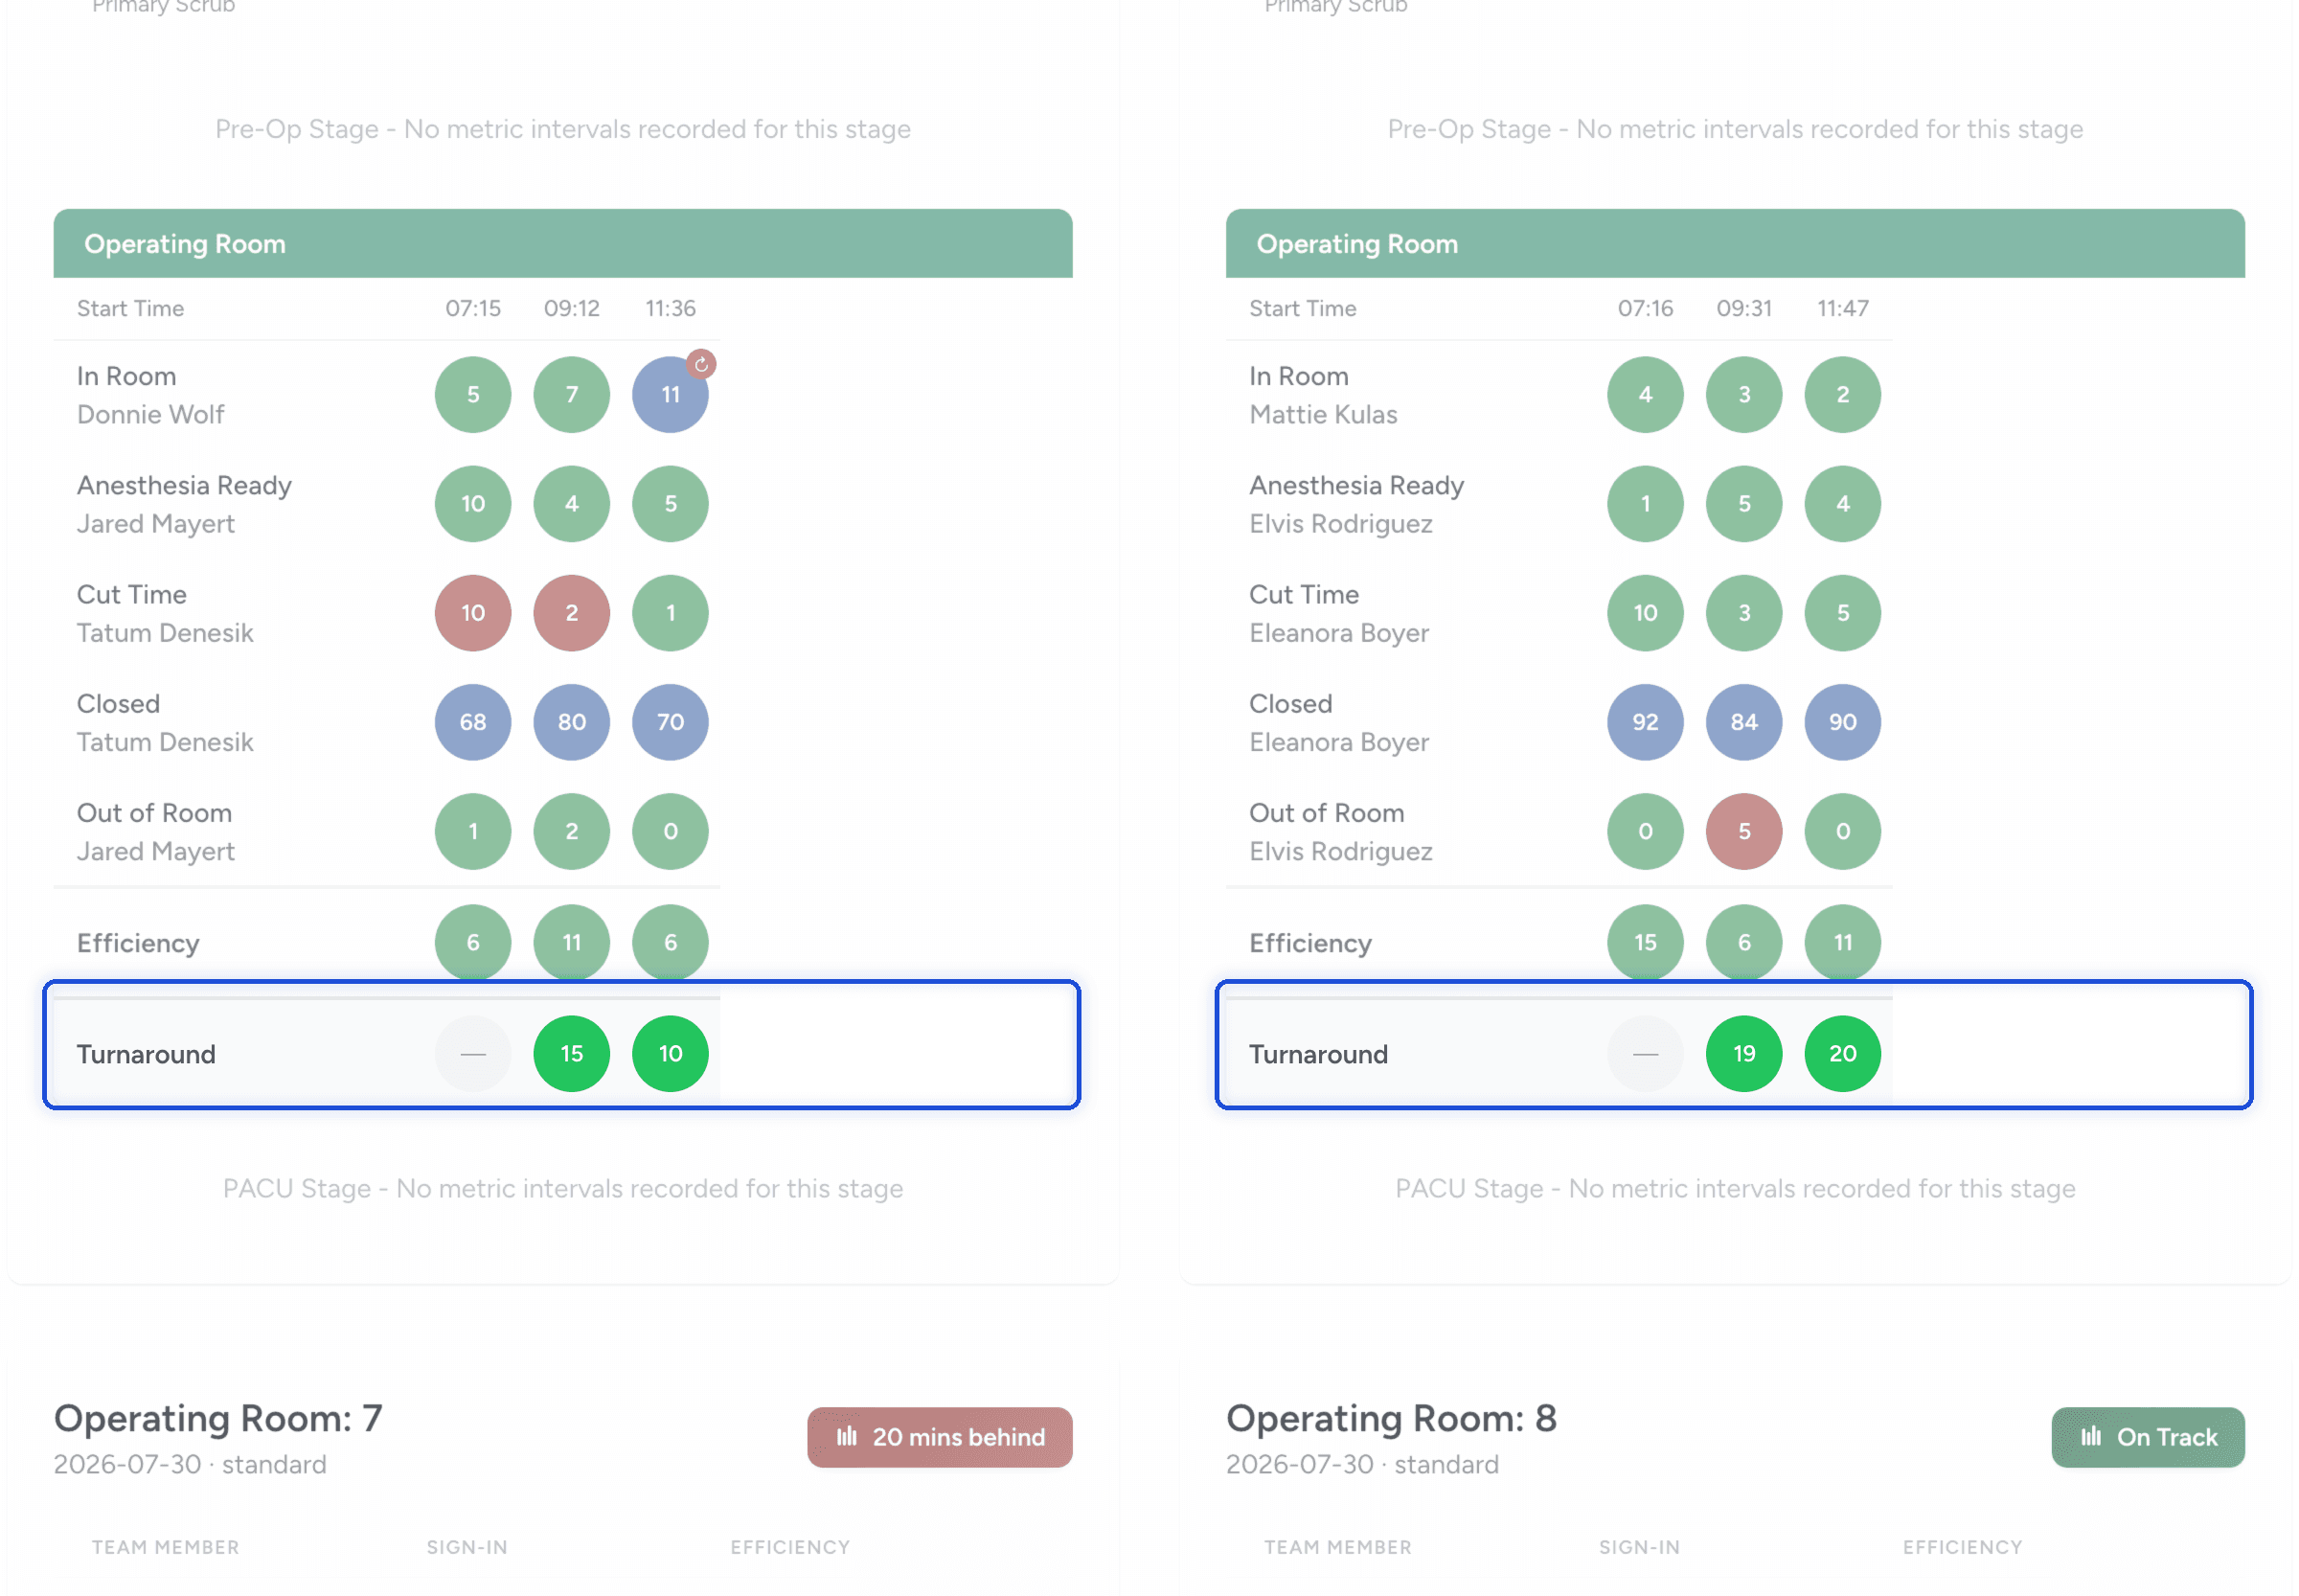
The most expensive metric you’re not measuring
Turnaround time stays invisible until someone measures it. Your EMR charts each interval after the fact. It records what happened, but it doesn’t track the gap between cases. Whiteboards and paper can’t keep up across every room in real time. So the minutes lost between one patient out and the next patient in never surface, and the room that runs behind all day looks the same on paper as the one that hums.
Those minutes are not free. At a published industry average near $47 per minute per room, every idle minute between cases is real money: fewer cases in the day, more overtime, and surgeons whose time you couldn’t protect.
How Synchrony measures turnaround time
Turnaround becomes a number you can see, per case, while the day is still running.
Define it
Turnaround is the time between one patient leaving the OR and the next patient entering it. You set the target you expect your team to hit, and it can vary by department and by case type.
Capture it live
Staff confirm each interval with a single tap on the tablet in the room. The turnaround between cases is measured as it happens, not reconstructed from yesterday’s chart.
Attribute it by role
Every minute saved or lost is tied to the surgical role responsible for it, so accountability lands on the team and not just on the room.
See turnaround the way your team actually runs it
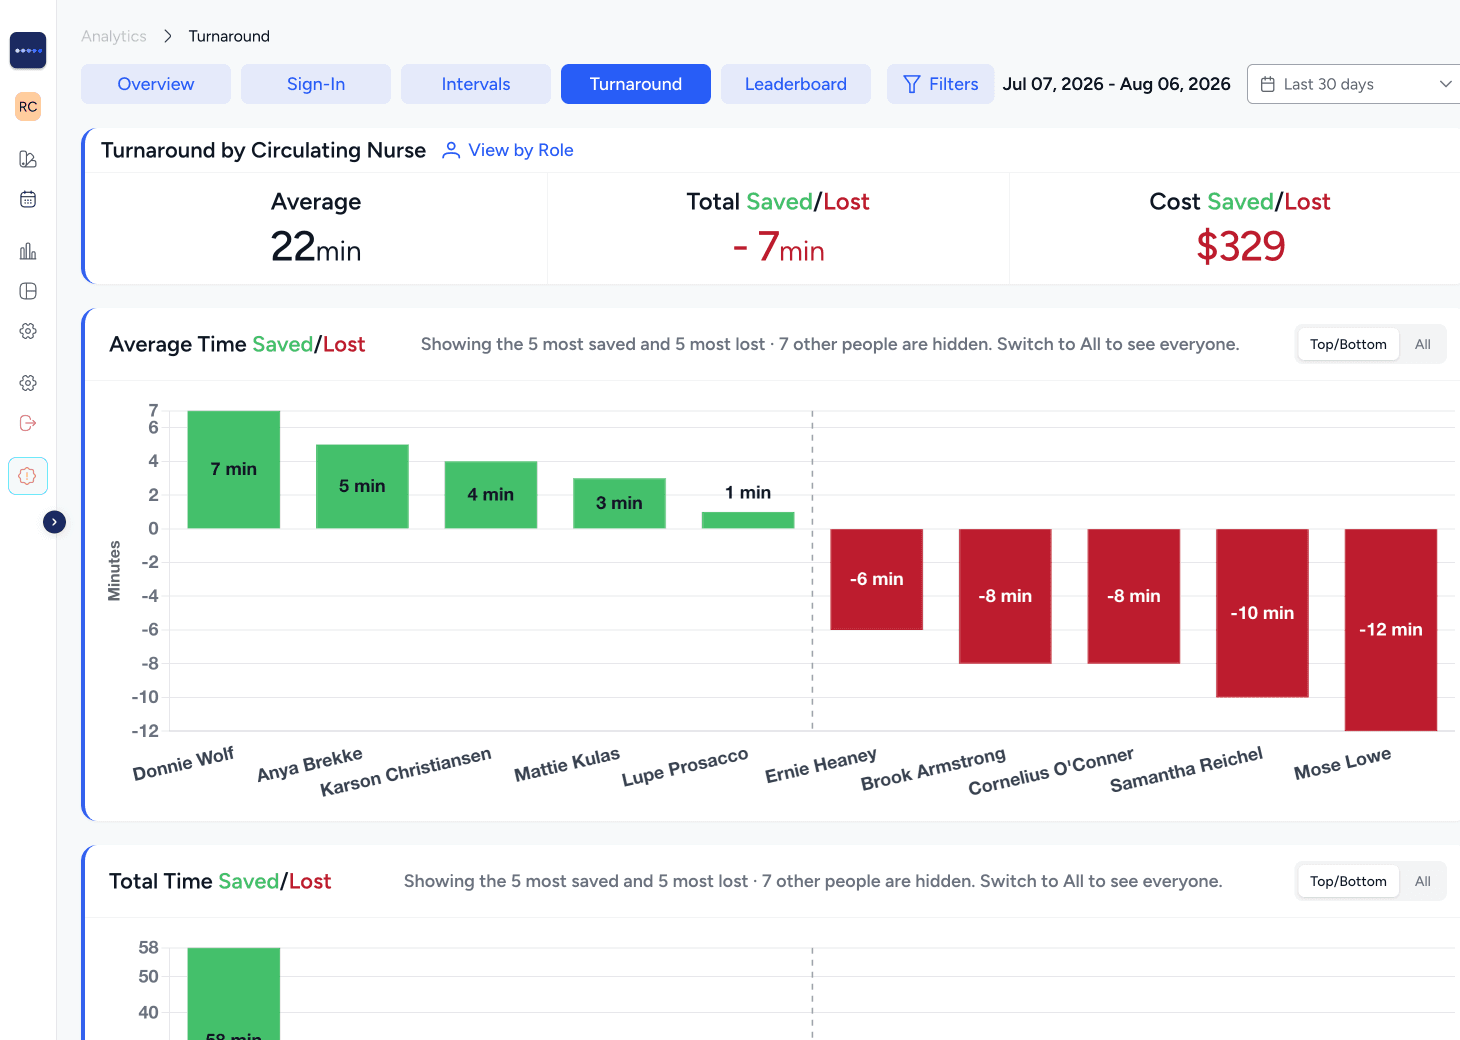
The Turnaround analytics tab turns the raw minutes into a picture leadership can act on:
- Your team's average turnaround time against the target you set, so you can see how close you are to your goal.
- Per circulating nurse performance, so you can see who is saving minutes and who is not.
- Switch between circulating nurse and surgeon, so you can see how the same gap looks different depending on who cares.
- The minutes converted to dollars at the industry $47-per-minute rate, so the ROI conversation happens on screen.
Turnaround is one of five intervals Synchrony tracks per case. See how Synchrony measures every interval.
Proof
Proof the method works
Defining and measuring interval expectations cut turnover from 47 to 20 minutes at the Spine & Joint Institute. They did it manually, starting from a 2012 co-management agreement between surgeons and administration. Synchrony is how you run that same method across every room, without a spreadsheet and a single champion holding it together.
The 20-minute result held year after year, and case volume tripled over four years as surgeons moved to the site that respected their time. Read the full story of how they cut turnover from 47 to 20 minutes.
47
min turnover, before
20
min turnover, sustained
Turnaround improvement that doesn’t backslide
Measuring turnaround once is a report. Holding it to a standard you keep raising is how the number stays down.
Define
Set the turnaround target your team should hit, per department and case type.
Display
Watch turnaround across every room as it happens, so a room running behind surfaces while there’s still time to act.
Analysis
When the data shows a target was set wrong, correct it and start measuring against the better number. Each pass raises the standard.
The rest of the surgical day
Time is lost in three places, and they compound: a late first case pushes every case behind it, and slow turnarounds push them again.
Sign-in and First Case on-time Start
Pre-Op, anesthesia, and surgeon readiness
Operating Room Efficiency
Case flow scored, minutes priced
See your turnaround time in real time
Book a walkthrough of the Turnaround tab on your own workflow. Start with a 60-Day Assessment ($4,850, credited in full if you continue), or measure continuously from day one.